Providers
Getting Started
It requires Python 3.7 or higher, check your Python version first.
It uses Graphviz to render the diagram, so you need to install Graphviz to use diagrams. After installing graphviz (or already have it), install the diagrams.
macOS users can download the Graphviz via
brew install graphvizif you’re using Homebrew.
”`shell
using pip (pip3)
$ pip install diagrams
using pipenv
$ pipenv install diagrams
Examples
| Event Processing | Stateful Architecture | Advanced Web Service |
|---|---|---|
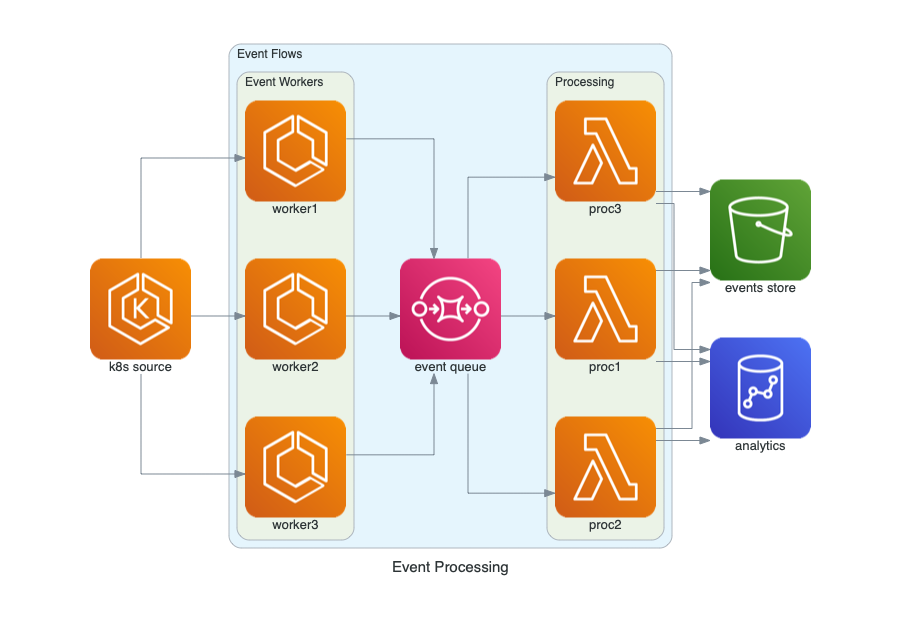 |
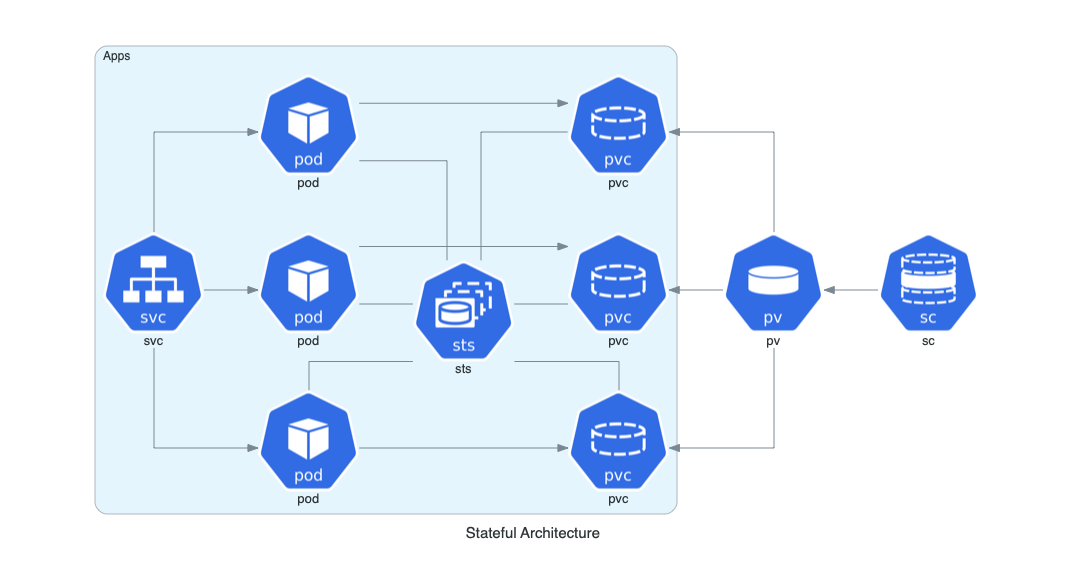 |
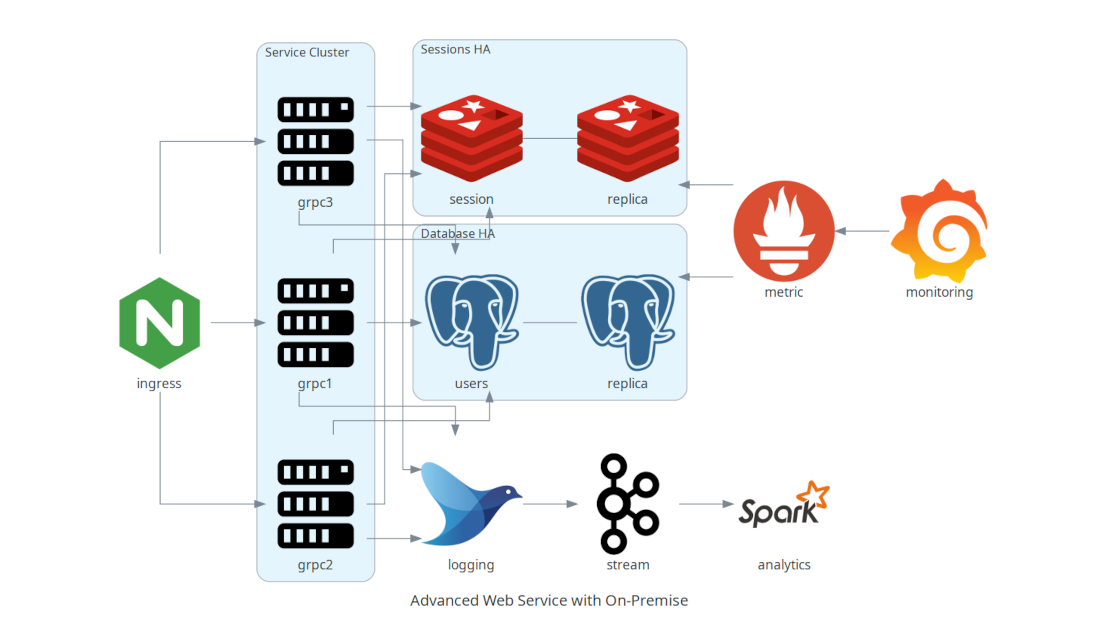 |
You can find all the examples on the examples page.
Who uses it?
Apache Airflow is the most popular data workflow Orchestrator. Airflow uses Diagrams to generate architecture diagrams in their documentation.
Cloudiscovery helps you to analyze resources in your cloud (AWS/GCP/Azure/Alibaba/IBM) account. It allows you to create a diagram of analyzed cloud resource map based on this Diagrams library, so you can draw your existing cloud infrastructure with Cloudiscovery.
Airflow Diagrams is an Airflow plugin that aims to easily visualise your Airflow DAGs on service level from providers like AWS, GCP, Azure, etc. via diagrams.
Other languages
- If you are familiar with Go, you can use go-diagrams as well.