One more heads up: As Swift evolves, if you are not using the latest Swift compiler, you shouldn’t check out the master branch. Instead, you should go to the release page and pick up whatever suits you.
- Xcode 14 / Swift 5.7 (master branch)
- iOS >= 12.0 (Use as an Embedded Framework)
- tvOS >= 12.0
- macOS >= 10.13
Okay so there’s this beautiful library called MPAndroidChart by Philipp Jahoda which has become very popular amongst Android developers, but there was no decent solution to create charts for iOS.
I’ve chosen to write it in Swift as it can be highly optimized by the compiler, and can be used in both Swift and ObjC project. The demo project is written in ObjC to demonstrate how it works.
An amazing feature of this library now, for Android, iOS, tvOS and macOS, is the time it saves you when developing for both platforms, as the learning curve is singleton- it happens only once, and the code stays very similar so developers don’t have to go around and re-invent the app to produce the same output with a different library. (And that’s not even considering the fact that there’s not really another good choice out there currently…)
3rd party tutorials
Video tutorials
- Chart in Swift - Setting Up a Basic Line Chart Using iOS Charts(Alex Nagy)
- Charts Framework in SwiftUI - Bar Chart (Stewart Lynch)
Blog posts
- Using Realm and Charts with Swift 3 in iOS 10 (Sami Korpela)
- Creating a Line Chart in Swift 3 and iOS 10 (Osian Smith)
- Beginning Set-up and Example Using Charts with Swift 3
- Creating a Radar Chart in Swift (David Piper)
- Plotting in IOS using Charts framework with SwiftUI (Evgeny Basisty)
- Set Up a Basic Bar Chart Using iOS-Charts (Penny Huang)
- iOS-Charts Tutorial: Highlight Selected Value With a Custom Marker (Penny Huang)
- Drawing Charts in iOS Before SwiftUI (Gennady Stepanov)
Want your tutorial to show here? Create a PR!
Troubleshooting
Other problems / feature requests
- Search in the issues
- Try to politely ask in the issues section
Carthage Install
DGCharts now include Carthage prebuilt binaries.
github "danielgindi/Charts" == 5.1.0
github "danielgindi/Charts" ~> 5.1.0
In order to build the binaries for a new release, use carthage build --no-skip-current && carthage archive Charts.
Swift Package Manager Install
Swift Package Manager
dependencies: [
    .package(url: "https://github.com/danielgindi/Charts.git", .upToNextMajor(from: "5.1.0"))
]
3rd party bindings
Xamarin (by @Flash3001): iOS - GitHub/NuGet. Android - GitHub/NuGet.
Questions & Issues
If you are having questions or problems, you should:
- Make sure you are using the latest version of the library. Check the release-section.
- Study the Android version’s Documentation-Wiki
- Search or open questions on stackoverflow with the
ios-chartstag - Search known issues for your problem (open and closed)
- Create new issues (please :fire: search known issues before :fire:, do not create duplicate issues)
Features
Core features:
- 8 different chart types
- Scaling on both axes (with touch-gesture, axes separately or pinch-zoom)
- Dragging / Panning (with touch-gesture)
- Combined-Charts (line-, bar-, scatter-, candle-stick-, bubble-)
- Dual (separate) Axes
- Customizable Axes (both x- and y-axis)
- Highlighting values (with customizable popup-views)
- Save chart to camera-roll / export to PNG/JPEG
- Predefined color templates
- Legends (generated automatically, customizable)
- Animations (build up animations, on both x- and y-axis)
- Limit lines (providing additional information, maximums, …)
- Fully customizable (paints, typefaces, legends, colors, background, gestures, dashed lines, …)
- Plotting data directly from Realm.io mobile database (here)
Chart types:
Screenshots are currently taken from the original repository, as they render exactly the same :-)
LineChart (with legend, simple design)

LineChart (with legend, simple design)
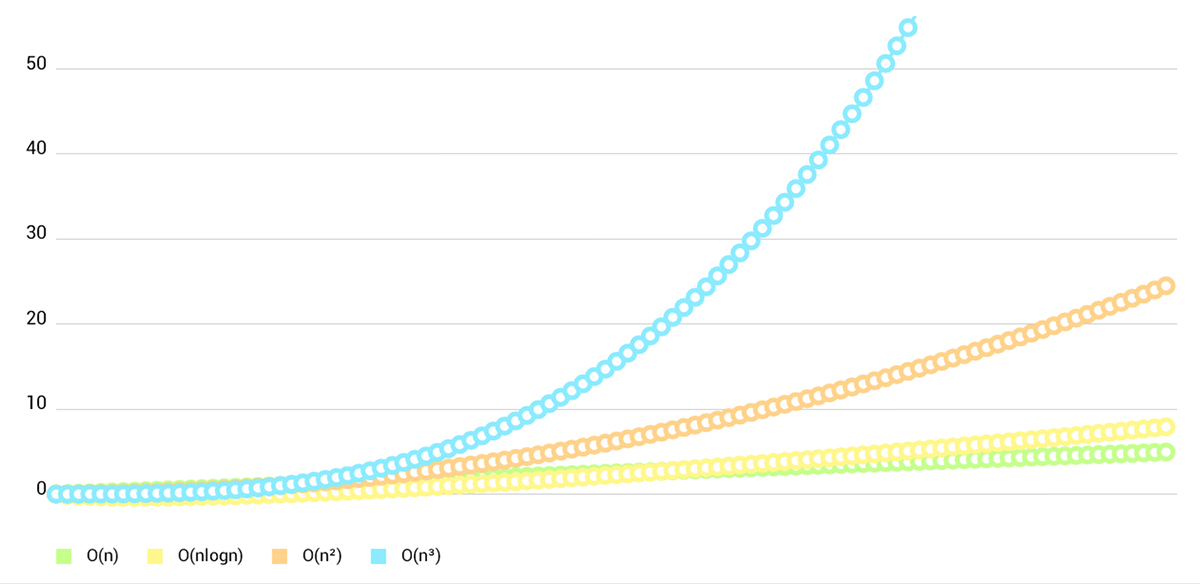
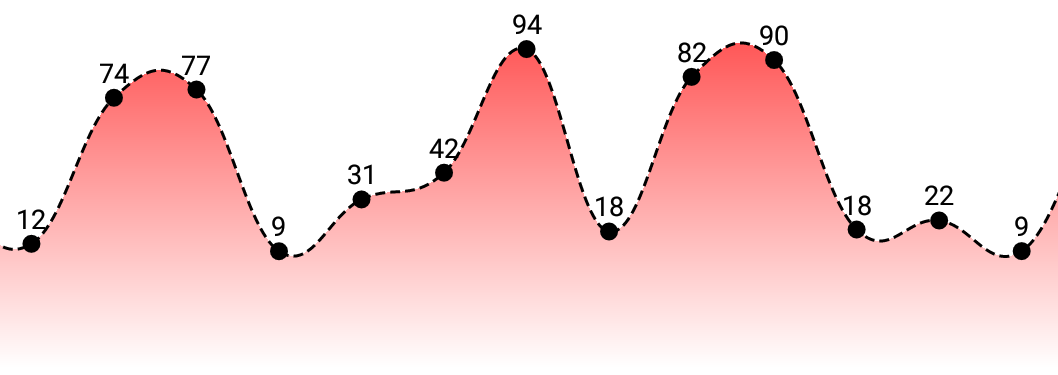
LineChart (cubic lines)
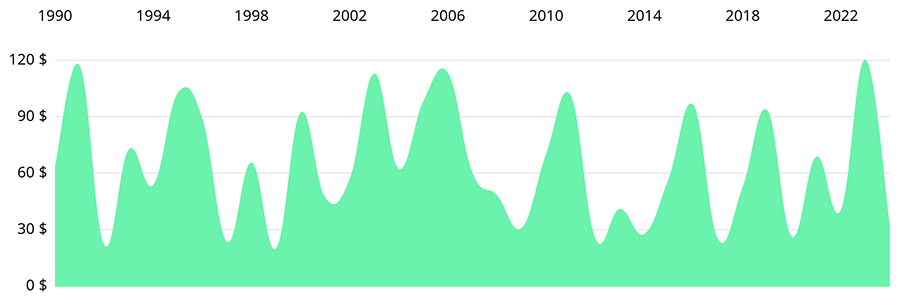
LineChart (gradient fill)
Combined-Chart (bar- and linechart in this case)
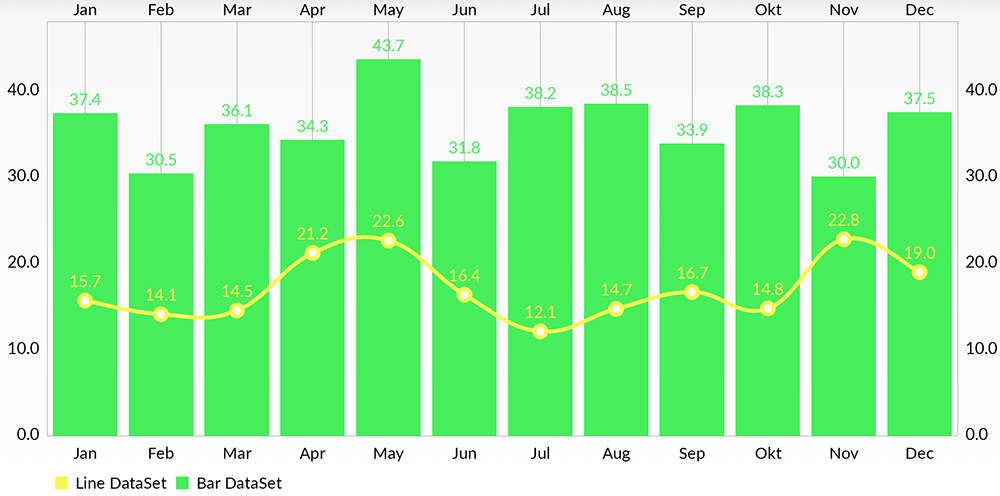
BarChart (with legend, simple design)

- BarChart (grouped DataSets)

- Horizontal-BarChart
- PieChart (with selection, …)

- ScatterChart (with squares, triangles, circles, … and more)

- CandleStickChart (for financial data)

- BubbleChart (area covered by bubbles indicates the value)

- RadarChart (spider web chart)

Documentation
Currently there’s no need for documentation for the iOS/tvOS/macOS version, as the API is 95% the same as on Android.
You can read the official MPAndroidChart documentation here: Wiki
Or you can see the Charts Demo project in both Objective-C and Swift (ChartsDemo-iOS, as well as macOS ChartsDemo-macOS) and learn the how-tos from it.
Special Thanks
Goes to @liuxuan30, @petester42 and @AlBirdie for new features, bugfixes, and lots and lots of involvement in our open-sourced community! You guys are a huge help to all of those coming here with questions and issues, and I couldn’t respond to all of those without you.
Our amazing sponsors
Debricked: Use open source securely
